AACR Financial Statement —
Revenues and Expenses 2015
In 2015, the AACR reported another year of positive financial growth. This financial stability enables the AACR to comprehensively meet the challenges of the cancer problem. Operating revenues increased 6 percent to $80 million and total expenditures closely matched revenues. The net impact of revenues and expenses resulted in an operating surplus of $708,000. As outlined in this report, several major projects were launched in 2015, and the AACR was able to outperform the budget through successful programming, revenue growth, and prudent financial management.
Non-operating activities are primarily related to long-term investments. After six straight years of positive performance in the AACR’s investment portfolio, the market corrected in 2015 and the portfolio experienced negative returns in the amount of $2.2 million. These returns were partly offset by the net operating surplus, resulting in an overall net deficit of $1.5 million for the year. At the end of 2015, the AACR had unrestricted net assets of $55 million, which ensures continued investment in the programs that will accelerate progress toward the prevention and cure of cancer.
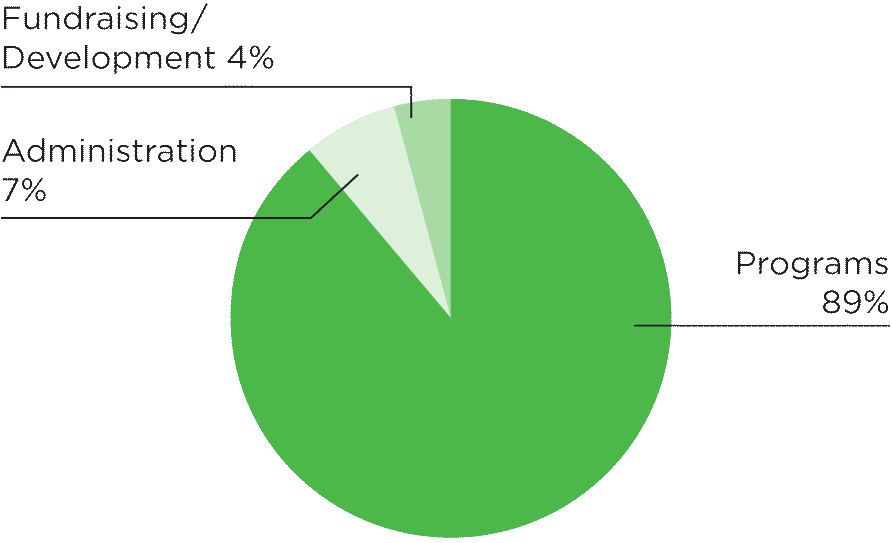
2015 Total Expenses

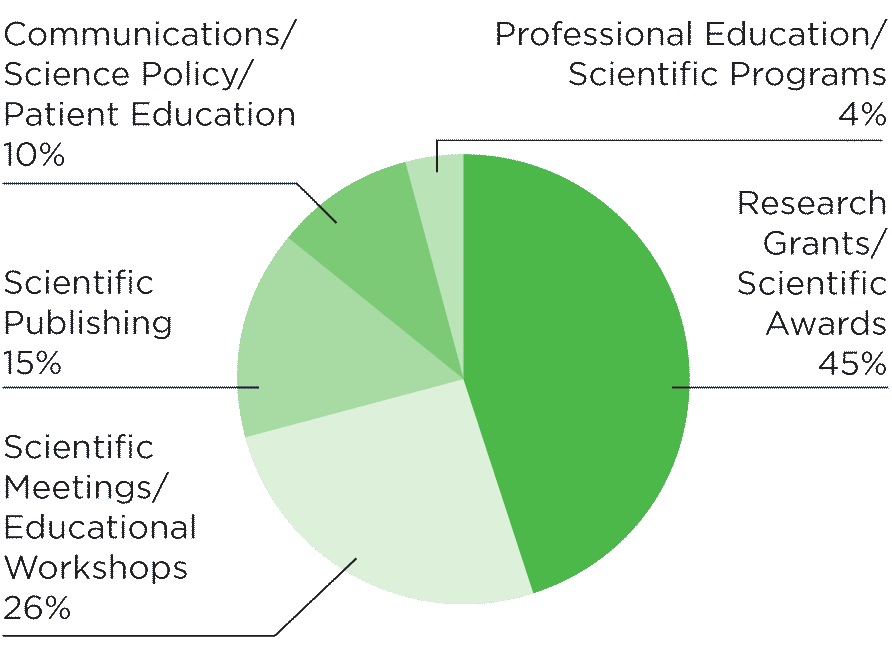
2015 Program Expenses
(% of Total Expenses)

American Association for Cancer Research, Inc. and AACR Foundation
Unrestricted Revenues and Expenses (Unaudited)
As of December 31, 2015
| 2014 | 2015 | 2015 Percent of Total | ||||
| REVENUE | ||||||
| Membership Dues | $2,930,621 | $3,196,495 | 4% | |||
| Scientific Publishing | $16,805,827 | $16,663,104 | 21% | |||
| Scientific Meetings / Educational Workshops | $15,356,680 | $20,796,899 | 26% | |||
| Other Revenue | $499,422 | $750,426 | 1% | |||
| Subtotal: Program Revenue | $35,592,550 | $41,406,924 | 52% | |||
| Support | ||||||
| NIH Grants | $820,597 | $872,051 | 1% | |||
| Contributions | $39,202,836 | $38,105,375 | 47% | |||
| Subtotal: Support Revenue | $40,023,433 | $38,977,426 | 48% | |||
| TOTAL REVENUE | $75,615,983 | $80,384,350 | 100% | |||
| EXPENSES | ||||||
| Research Grants / Scientific Awards | $30,930,096 | $31,379,839 | 39% | |||
| Scientific Meetings / Educational Workshops | $14,762,461 | $18,542,272 | 23% | |||
| Scientific Publishing | $11,094,165 | $10,736,399 | 13% | |||
| Communications / Science Policy / Patient Education | $5,833,030 | $7,195,979 | 9% | |||
| Professional Education / Scientific Programs | $1,782,654 | $2,852,769 | 4% | |||
| Subtotal: Program Expenses | $64,402,406 | $70,707,258 | 89% | |||
| Support Services | $6,225,968 | $5,412,872 | 7% | |||
| Fundraising / Development | $2,460,464 | $3,555,983 | 4% | |||
| Subtotal: Support Expenses | $8,686,432 | $8,968,855 | 11% | |||
| TOTAL EXPENSES | $73,088,838 | $79,676,113 | 100% | |||
| Operating Surplus before Investments | $2,527,145 | $708,237 | ||||
| Investment Income | $2,372,739 | ($2,210,636) | ||||
| Change in Unrestricted Net Assets | $4,899,884 | ($1,502,399) | ||||
| NET ASSETS BEGINNING OF YEAR | $51,998,173 | $56,898,057 | ||||
| NET ASSETS END OF YEAR | $56,898,057 | $55,395,658 |